Appliances with occasional use
There are some appliances that are occasionally included in the mix pf appliances that the user switches-on during the day. For example, iron, stereo, printers and …
Within ramp, the user may specify the probability of using an appliance on the daily mix with a parameter called, occasional_use.
When occasional_use = 0, the appliance is always present in the mix and when occasional_use = 1, the appliance is never present.
The following example, investigates the effect of this parameter by modelling two user category: * A household that uses a computer with ocationally * A school that uses the computer everyday
# importing functions
from ramp import User,calc_peak_time_range,yearly_pattern
import pandas as pd
Creating a user category and appliances
household = User("Household")
school = User("School")
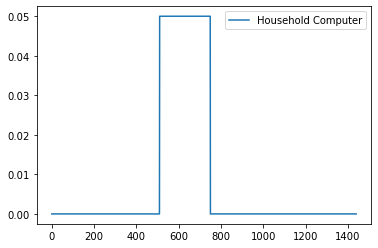
computer_0 = household.add_appliance(
    name = "Household Computer",
    number = 1,
    power  = 50,
    num_windows = 1,
    func_time = 210,
    occasional_use = 0.5,  # 50% chance of occasional use,
    window_1 = [510,750],
)
computer_1 = school.add_appliance(
    name = "School Computer",
    number = 1,
    power  = 50,
    num_windows = 1,
    func_time = 210,
    time_fraction_random_variability = 0.2,
    func_cycle = 10,
    occasional_use = 1, # always present in the mix of appliances,
    window_1 = [510,750],
)
# Checking the maximum profile of the two appliances

max_profile_c1 = pd.DataFrame(computer_0.maximum_profile,columns=[computer_0.name])
max_profile_c2 = pd.DataFrame(computer_1.maximum_profile,columns=[computer_1.name])

max_profile_c1.plot()
max_profile_c2.plot()
<AxesSubplot:>

Generating profiles
peak_time_range = calc_peak_time_range(
    user_list = [household,school]
)
year_behaviour = yearly_pattern()
# plotting profiles for 5 days
days = range(10)

for day in days:
    household_profile = household.generate_single_load_profile(
        prof_i = day,
        peak_time_range = peak_time_range,
        Year_behaviour = year_behaviour
    )

    school_profile = school.generate_single_load_profile(
        prof_i = day,
        peak_time_range = peak_time_range,
        Year_behaviour = year_behaviour
    )

    pd.DataFrame(
        data = [household_profile,school_profile],
        columns = range(1440),
        index = [household.user_name,school.user_name]
    ).T.plot(title=f"day - {day}")

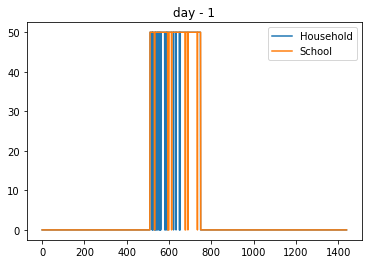


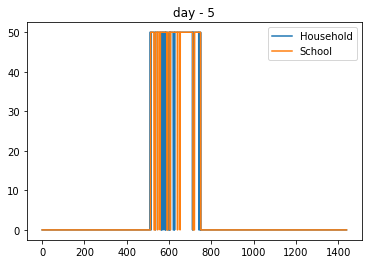
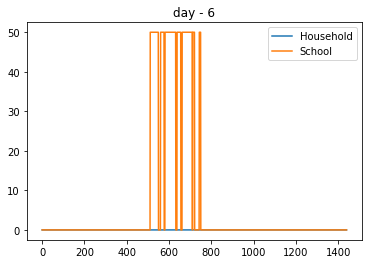


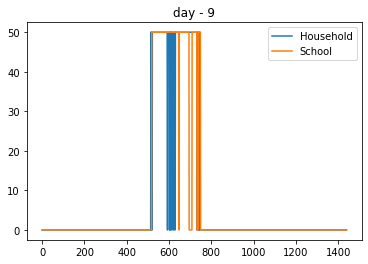
As it can be seen from the figures, the computer is always present in the school appliance mix while for household, is occasionally present.